
I’ve been looking at real estate for about a month now, wondering if the time is right to buy a home, or if I should continue to wait. Unfortunately I may never know the answer to that question, as it’s almost always impossible to time the market. I can, however, use statistics and reason to at least come to an educated guess. That’s what I’ve tried to do with the following graph:
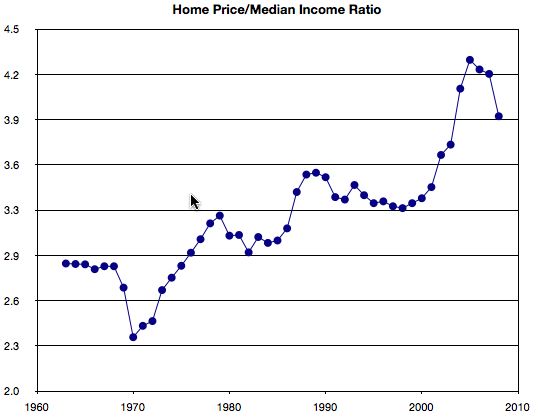
Let me explain what I’ve done. I looked up the U.S. Census figures for the median new home price in the U.S. from the years 1963 through 2006. I also looked up U.S. Census figures for the median household income in the U.S. from the same time period. Then I divided the median price by the median income to come to a number. That number is what you see on the above graph.
As you can see, up until the mid-70’s the median price of a home never exceeded more than three times the median household income. At the peak of the Real Estate market that number was up to almost 4.5x the average household income. What does that tell me? It tells me what everyone already knows – houses were just too damn expensive.
Obviously we’ve seen a major reduction in home prices, but thanks to the recession we’re also starting to see falling income levels. Unfortunately I didn’t have figures from the U.S. Census for the years 2007 and 2008, so I guesstimated that the average houshold income is holding relatively steady from the year 2006 (of course this may be completely incorrect). I was able to get the median new home prices for the years 2007 and 2008, so I did not have to guess those figures.
As you can see on the far right side of the graph the market is beginning to collapse. But it’s still far above what it has historically been. Based on that I’m afraid now may still not be the time to buy… at least if you want to buy at the bottom of the market.
Any thoughts?


Leave a Reply