Today we’ll be continuing the Investing for Beginners series with an introduction to interpreting a companies Balance Sheet as well as their Statement of Cash Flows. Let’s begin with the balance sheet.
The Balance Sheet
There are a lot more rows to this one eh? Don’t get intimidated, there is nothing to it! I promise.
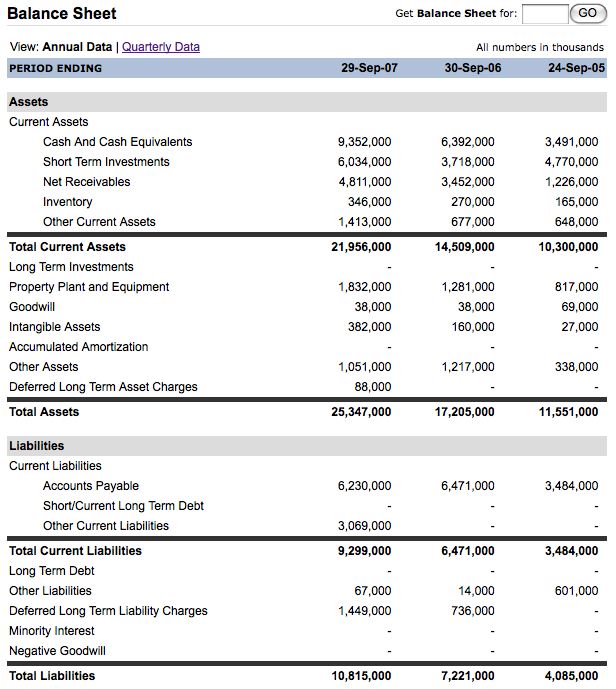
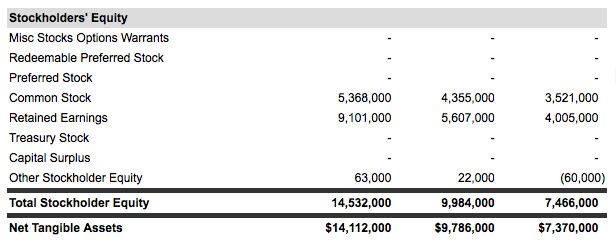
Let’s start from the top. We’re looking at Apple’s balance sheet, which shows all of their assets, liabilities and their stockholder equity (sometimes known as owners equity). Just about everything listed on the balance sheet is pretty important but for simplicities sake we’ll just go over cash, receivables and inventory on the “assets side” plus accounts payable on the “liabilities side.” We’ll also look at Total Assets and Total Liabilities.
Breakdown of the Assets:
Anything that can be immediately converted to cash.
The cash and cash equivalents increased by 83% from the year ended 2006 over the year ended 2005. For the year ended 2007 their cash increased 46%. These are some fantastic numbers. There’s nothing much to worry about with the exponential decrease in cash from 2006 to 2007, as it’d be impossible to maintain such high increases YoY (year over year). Naturally you’re going to be wanting to look for a company that has increasing cash YoY on the assets side. If their cash does drop you’ll need a good reason why, otherwise it could be a warning sign that the company is struggling.
Receivables are also known as accounts receivable and is any monies owed to the company for the receipt of sales and services.
Now let’s take a look at receivables. These numbers can be somewhat deceiving, in that increasing receivables tends to imply increasing sales, but could just as well mean that a company is resorting to cheap financing tricks to “temporarily” boost their numbers. So be careful with this one. I happen to know that Apple truly is experiencing some vastly increasing sales numbers, so the increases in Receivables, while a little high, are not too far off. So what are the numbers? 2006 over 2005 saw an increase in receivables of 181% while 2007 over 2006 saw an increase of 39%.
Inventory:
The worth of any inventory that a company has on hand. Could be both finished products as well as raw materials & parts.
Finally let’s take a peek at inventory levels. 2006 over 2005 saw an increase in inventory of 63% while 2007 over 2006 saw an increase of 28%. Inventory numbers can be somewhat decieving, just as the receivables can be. While an increasing inventory level could mean that a company is not selling goods as quickly as it should be, it could also mean that they are simply increasing production or adding more product lines, or even require more inventory on hand. It helps to know about the companies business with these numbers.
Current Liabilities:
2006 over 2005 saw an increase in accounts payable of 85% while 2007 over 2006 saw a decrease of about 4% in accounts payable. While this number obviously implies that in 2006 Apple didn’t seem to want to pay their bills, it likewise shows that they’ve done a great job in 2007 of paying them down, due to the decrease in accounts payable.
Total Assets:
An easy way to get a general idea of how well a company is doing on increasing their assets and decreasing their liabilities is to do a calculation on the total assets. For simplicities sake let’s take a look at the total assets again.
![]()
Now if we divide the year 2006 by the year 2005 (far right number) we come up with a 49% increase in assets from the year 2005 to the year 2006. Let’s do it again. 25,347 divided by 17,205 will give us an increase of 47%. These are very large numbers and definitely imply that Apple is growing their business, which is definitely a good thing for a shareholder.
Total Liabilities:
With liabilities it’s always nice to see a decreasing number, but sometimes if it’s decreasing too rapidly that can be dangerous as well. For example if a company is paying off all of their debt with any spare cash they have and then suddenly run into hard times they’ll all of a sudden have very little cash and may not be able to survive. On the flip side increasing liabilities aren’t necessarily a bad thing as long as the company is growing at least as much as it’s taking on debt (keep in mind also that liabilities are only short-term debt). Let’s digest Apple’s liabilities.
![]()
So for the year ended September 2006 their liabilities increased by 76% and for the year ended Sep 2007 they increased by 49%. The increase is a little large for the first year we looked at, but it comes back down in the next year to basically match the growth rate in assets.
The Statement of Cash Flows
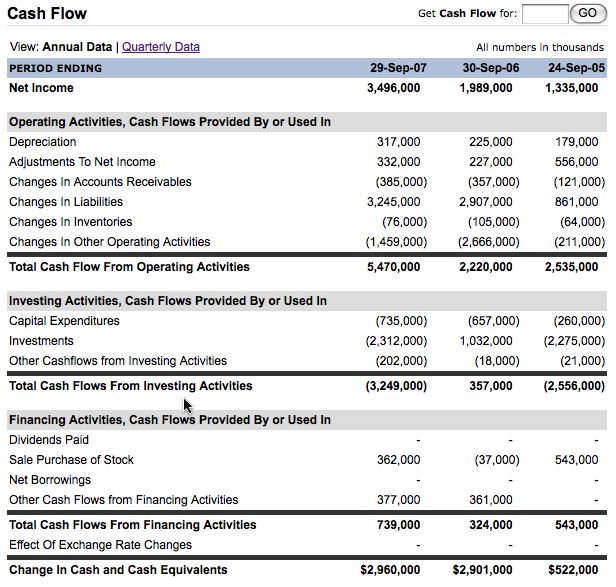
The statement of cash flows is of utmost importance when it comes to a company’s fundamentals. It is split into three sections: the cash flows from operating activities; the cash flows from investing activities and the cash flows from financing activities.
The operating activities is all of the day to day operations: depreciation, inventories, net income, assets, liabilities. The investing activities refers to all of the investments the company makes, not only in stocks but in other companies and even itself (equipment, buildings, etc.). The financing activities refers basically to any monies received or paid due to the sale of stock or any borrowed money, etc.
We’ll finish off by looking at the very bottom line of the Statement of Cash Flows: the Change in Cash and Cash Equivalents. It’s been said before and I’ll say it again, cash is king. Therefore we want to see companies increasing their cash pile year after year. If it’s decreasing every single year then they might be running into some serious problems in the near future, if they haven’t already. So by looking at Apple’s change in cash we can clearly see that they are bringing in cash every year. This is great news. Feel free to do the math to see how it figures out on a percentage basis, but know that what’s most important is that they’re bringing in cash, and not necessarily always how much cash they’re bringing in.
That finishes off the Analyzing Financial Statements mini-series. Look for another entry in the Investing for Beginners series within the next week! Don’t forget to leave your comments and subscribe!


2 responses to “Investing for Beginners: Analyzing Financial Statements, pt. 2”
Nice tutorial Joe. I need to get better at taking the time to really pore over these things when my money is on the line. That looks like Google finance right? Is that your preferred place to check out these numbers?
Blakes last blog post..In The Moment vs. Delayed Gratification: Part III
awesome comment about credit